Rental Return on Investment Property
Concept
In this approach of evaluating whether Cape Town’s residential property is overpriced, housing is looked at from an investment point of view. The quality of the investment will be established by analysing the rental returns in comparison to the purchase price of various residential properties in different areas.
The analysis will compare the annual return on investment with returns from a money market investment. If the finding shows that the rental return for the investment property is significantly lower than an alternative investment, such as investment bank accounts, bonds or shares, it is either suggested that property is over-priced or perceived to have longer term capital growth benefit by means of capital appreciation.
Method
The data for the rental properties was gathered on the Internet by collecting rental prices for various properties in different suburbs of all areas. Properties included apartments, flats, penthouses, as well as houses with small and large stands. The rental square meter rate per month for each property was calculated by dividing the rental price per month by the dwelling size. The average rental price per square meter for each area was calculated by averaging the rental price per square meter of all selected properties.
Please note: As it is difficult to establish an ‘adjusted R/m2’ for properties, and in order to be able to compare houses with units such as apartments the outside and garden areas of all houses were neglected; only the inside living area of the house was taken into account. This results in a slightly more expensive average rental price per square meter for areas with large stands, such as Constantiaberg, as well as Hout Bay.
The rental return on investment was determined by comparing the average annual rental income per square meter with the average sales price per square meter for each area. For the average sales prices, the sales data of the year 2011 was utilised to establish a more accurate average purchase price.
Analysis
The table below shows the monthly and annual average R/m2 rates for rental property in each area.
The Atlantic Seaboard is the most expensive area in terms of rental, as well as purchase properties; however, the rental return on investment of 8% for this area is rather low compared to other areas, in which property is more affordable. The comparatively low return on investment compared to other areas suggests that the rental rates are underpriced, or the purchase price in this area is overpriced.
The average rate (per unit) for the rentals collected in the Atlantic Seaboard accounts to over R23,000 per month compared to Constantia where the rent per month averages out on approximately R32,000 per month. House sizes in Constantia are generally larger, which may explain why the return on investment is greater than in the Atlantic Seaboard. However, the sales data for the Constantiaberg area is not restricted to property in upmarket Constantia but also includes the large amount of sales in generally more affordable suburbs such as Plumstead, Diep River and Kristenhof. This could have had a positive effect on the return on investment as shown in the table below.
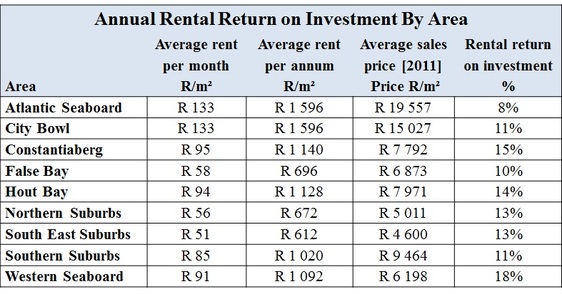
The rental return for property in Hout Bay, Northern Suburbs and the South East Suburbs is between 13% and 14%. On the other hand, housing in the Southern Suburbs, as well as the City Bowl shows an annual return of approximately 11%. It should be noted that the high return on investment in the Constantiaberg and Hout Bay area may be a result of high incidence of gardens & larger plot sizes, which are not accounted for in the calculation.
Comparing to the current SA prime interest rate of 9% shows the extent of the return on investment, with rental return on investment property in all areas apart from Atlantic Seaboard above the current prime interest rate.
It should be noted that the maintenance cost of the investment property, as well as the possible costs of a letting agent have been neglected. Taking these costs into account will decrease the return on investment by a further one to two percentage points. Nevertheless this still leaves us with a substantial return on investment in most areas.
