Historical Sales Trends
Concept
Through the analysis of historical property sales trends, key cycles and events can be observed and used to establish whether the property prices are currently climbing or sliding – indicating whether it is a good time to buy or sell property.
By comparing the listed property price to its eventual sale price, a measure of expectation can be gained. Similarly, the volume of sales can be used to indicate the interaction between supply and demand: Low sale volumes with higher than usual sale prices would indicate that the market is over-priced and fewer buyers are willing to spend, while low sale volumes with low sale prices would indicate that the market is under-priced and fewer sellers are willing to sell. In a similar manner, the number of days a property is listed can also provide an indication of market confidence.
Method Using a R/m2 rate, listed and actual sale prices are compared over time, and contrasted with sales volumes, as well as number of days listed. External historical events are then used to interpret potential causes of any trends, as are inflation rates.
Analysis

Most striking in the graph is the large dip in sales volumes in the middle of 2007, from 443 sales per month down to 132 in a 6 month window. While the first conclusion is that this is a consequence of the great recession, it begins 3 months prior, and is in fact the introduction of the National Credit Act in June 2007. This act required banks to apply significantly more stringent credit requirements before
extending mortgages, resulting in the consequent drop in sales volume. Although there was a slight decline in prices
during this period, overall for the next year they stayed relatively steady. However,
the difference between list price and sale price has widened, from a 4.5%
discount to a 11.3% discount, which still remains to be the average acceptable
offer discount today. Also noticeable is the increase in the average number of
days a property is listed, from 60 days in the beginning of 2007 to between 100
and 120 days in the last few years, which indicates that sellers are waiting
longer to get an offer they find acceptable.
The recovery in sales volumes between November 2008 and December 2009 corresponds to the lowering of interest rates to help aid recovery from the recession. The prime rate in October 2008 was 15.5 %. By December 2009 it had dropped to 10.5%, making mortgages significantly cheaper and houses consequently easier to buy.
From a seasonal point of view, the clearest effect is a plummet in sales volumes every December, with sales peaks in November and January – the result of estate agents, banks and government all going on holiday for a few weeks. Prices also seem to vary slightly by season, with winter prices being around 5 - 7% lower than their previous summer prices (However, 2009 is an exception to this trend).
Looking at the last 2 months (January and February 2012), average prices have climbed almost 21% over the last 4 months since September 2011. Similarly, sales volumes have dropped by 20%, and the usual ‘post-December-spike’ recovery in volumes has not occurred. This seems to indicate that currently properties are most likely over-valued and one would expect the prices to drop in the next few months to come.
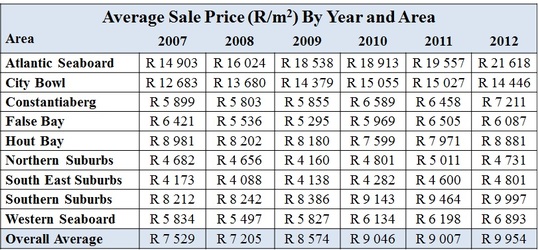
Analysing the numbers on an area level, the greatest area of growth has been the Atlantic Seaboard, increasing by 45% over the last 5 years. Perhaps a large reason for this was the FIFA soccer world cup, which resulted in significant spending by the city in urban renewal and upgrade projects in the area. Most surprising is the long-term decrease in value in False Bay and Hout Bay, which dropped by 5.2% and 1.2% respectively in the last 5 years.
The only area with consistent year-on-year growth over the period has been the Southern Suburbs – most likely due to the relatively high proportion of ‘established middle class’ in the area, who are less likely to experience financial pressures which would force them to accept lower prices.
The only area with consistent year-on-year growth over the period has been the Southern Suburbs – most likely due to the relatively high proportion of ‘established middle class’ in the area, who are less likely to experience financial pressures which would force them to accept lower prices.
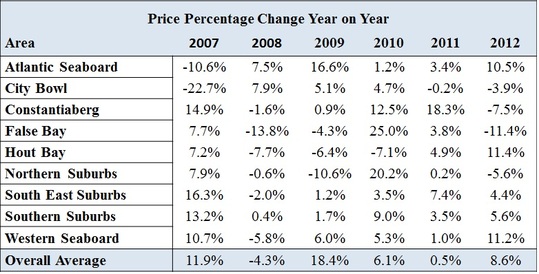
While the above tables show overall a general increase in property values, a dramatically different picture is shown by looking at real prices, discounted for inflation (using 2007 prices as a baseline). Only the Atlantic Seaboard has managed to outpace inflation – with the remaining area prices all decreasing in real terms over the 5 year period.
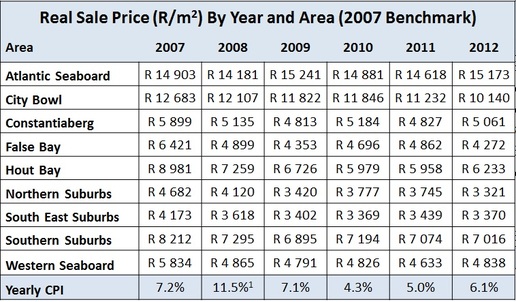
1 In 2008, The Reserve Bank altered its measurement of CPI to include owner’s equivalent rent. The inflation numbers quoted in 2007 and 2008 are not reflective of this change.
The significant decline in terms of real pricing illustrates how property prices often re-align to market conditions through stagnation, rather than a nominal price reduction. This is understandable from a psychological perspective, as owners would always prefer to sell their property ‘for more than it was bought for’ – although from a strictly economic point of view, this is false. Although speculative in logic, it could be argued that areas which have dropped the most during this time are possibly undervalued by now, which suggests that prices in these areas will increase, or at least keep in line with inflation. If such an outlook was taken, False Bay and Hout Bay properties would be the greatest areas for a recovery in prices. While indeed Hout Bay’s prices have increased from 2011 to 2012 by 11.4%, any increase in confidence in this speculation for an imminent recovery (which could be suggested by this increase) should be offset by the fact that False Bay fell by an equivalent amount over the same time period. The continuous decline in real prices in most areas suggests that property prices are currently overvalued. To establish the full extent of this overvaluation one would need to wait for the bottom of the trough to be reached and the real prices to start recovering.
